Web App

5 min
Discover what drives web app development cost in 2026: complexity, integrations, compliance, and team model. See price ranges from MVPs to enterprise builds, regional comparisons, partner types, and hidden expenses like testing, security, and post-launch support. Get quick estimators, tables, and guardrails to keep web app development cost realistic and defendable, helping you plan a phased roadmap without surprise overruns.

By Dhruv Joshi
17 Nov, 2025
Planning a web app for 2026? You are probably finding a draft feature list, a rough timeline, and a number that keeps changing every time someone says “What if we also…”. One meeting says “we can reuse components,” the next uncovers an integration you did not know existed. By the end of the week, the estimate feels more like a guess than a plan.
This guide fixes that. We break web app development cost into clear parts: what drives price, how complexity changes the total, how partner choices affect outcomes.
You will walk away with realistic ranges, comparison tables, and a simple method to build a credible web app development budget for 2026 without hand-waving or surprise line items later.
Let's start with the key web app development cost factors.
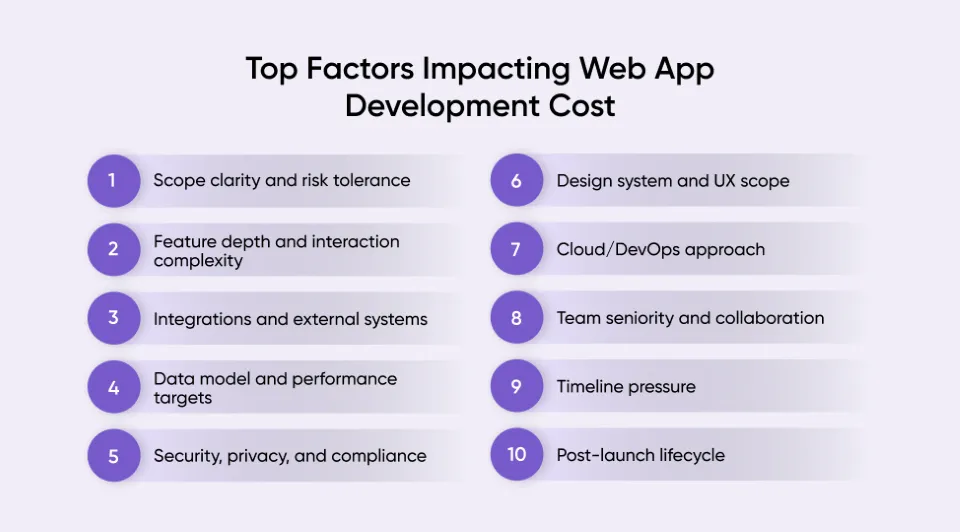
Your web app development cost is not a single line item. It is the sum of many design, engineering, and operational choices that compound. Below are the web app development cost factors that move numbers the most and how they tend to do it in real projects.
Compressed schedules mean parallel streams and higher coordination cost; expect rush multipliers of 15–35%.
A clear definition of each factor and how you will trade them does more to de-risk your budget than any single tool choice.
Not every web app needs the same muscle. Use the tiers below to anchor expectations and align stakeholders early.
| Tier | Typical Features | Team Shape | Typical 2026 Cost (USD) |
|---|---|---|---|
| Starter / MVP | Auth, basic roles, 6–10 screens, CRUD, simple dashboard, 1–2 integrations | 1 PM, 1 Designer, 2–3 Devs, QA part-time | $40k–$140k |
| Professional | Multi-tenant, complex forms, role matrix, 3–5 integrations, exports, analytics | PM, Designer, 3–5 Devs, QA, DevOps | $120k–$280k |
| Advanced | Real-time collab, offline support, SSO/SAML, API, audit logs, granular permissions | PM, Lead Eng, 4–7 Devs, QA, DevOps | $250k–$500k |
| Enterprise | High concurrency, data partitioning, compliance (HIPAA/PCI), custom reporting, heavy automation | Program Manager, Architect, 6–10 Devs, QA, DevOps/SRE | $450k–$1.2M+ |
Decision tip
Pick the lowest tier that still proves your core value, then plan a funded Phase 2. This keeps the first release tight and gives you budget leverage for what you learn.
Even disciplined teams get surprised by items that do not show up as “features” yet are essential for a healthy product. Keep these on your radar so your web app development budget is honest from day one.
Budgeting for these items does not inflate your number; it prevents overruns and reinforces trust with finance and stakeholders.
Different product patterns have predictable signatures. Use these 2026 ranges as planning anchors. Assumes a solid, production-ready implementation with a blended rate appropriate to the chosen region and partner type (more on that below).
| Web App Type | Typical Feature Set | Estimated 2026 Cost (USD) |
|---|---|---|
| B2B SaaS MVP | Auth, roles, 8–12 screens, billing, dashboards, 2–3 integrations | $120k–$260k |
| Marketplace (two-sided) | Listings, search, messaging, escrow/Payments, KYC, admin tools | $180k–$420k |
| E-commerce (custom, headless) | Product catalog, promotions, inventory, checkout, OMS integration | $150k–$350k |
| Healthcare portal | PHI handling, appointments, secure messaging, audit logs, consent | $220k–$500k |
| Fintech dashboard | External data aggregation, secure flows, reporting, fraud checks | $200k–$480k |
| Real-time collaboration | Presence, conflict resolution, offline sync, shared canvases | $250k–$600k |
| Analytics portal | ETL, warehousing, role-based insights, exports, scheduling | $180k–$450k |
| Education/LMS | Courses, progress, assessments, proctoring/integrations | $160k–$360k |
| Internal admin tool | Auth, CRUD, bulk ops, approvals, audit trails | $60k–$180k |
| Public service portal | Accessibility AA/AAA, multilingual, queue mgmt, verifications | $180k–$420k |
Planning for enterprise scale? If you are estimating the cost to build enterprise web app capabilities like SSO, audit trails, and strict SLAs, expect budgets to start near $450k and rise past $1.2M as integrations and compliance deepen.
These four decisions typically explain 70% of cost variance for a given app type.
Here are the Total project prices (based on 2026 planning ranges). These ranges include discovery, design, engineering, QA, DevOps, and project management. It excludes third-party licenses, payment/provider fees, and cloud usage.
| Partner Type | Starter / MVP | Professional | Advanced | Enterprise |
|---|---|---|---|---|
| Freelancers (1–3 people) | $35k–$90k | $90k–$180k | $180k–$350k | $350k–$800k |
| Boutique studios (5–20 people) | $55k–$130k | $130k–$260k | $220k–$420k | $400k–$950k |
| Mid-size product agencies (20–200 people) | $80k–$160k | $160k–$320k | $280k–$520k | $500k–$1.2M |
| Global consultancies / enterprise vendors | $150k–$300k | $300k–$600k | $500k–$900k | $900k–$2.0M+ |
| Staff augmentation / dedicated pods | $60k–$140k | $140k–$300k | $260k–$520k | $480k–$1.1M |
If you need an end-to-end partner that can run discovery, design, engineering, and DevOps under one roof, explore our Web app development services for transparent scoping and milestone-based pricing.
Rates vary by geography, but the gap is narrower at senior levels. The table below reflects typical blended rates (developers + design + QA + PM) for 2026 budgeting, informed by 2024–2025 market observations, including a softening in several regions as AI-assisted delivery improves throughput.
| Region | What You’re Paying For | 1,000-Hour Project (Illustrative) |
|---|---|---|
| US & Canada | Cross-functional depth, compliance, on-shore collaboration | $110k–$185k |
| Western/Nordic Europe | Strong engineering culture, design quality, EU compliance | $90k–$160k |
| UK/Ireland | Enterprise experience, fintech/health talent | $95k–$170k |
| Central/Eastern Europe | Senior talent pools, strong English, EU time-zone overlap | $55k–$120k |
| Latin America | US time-zone overlap, diverse stacks | $50k–$110k |
| South Asia | Large scale, cost efficiency, wide range of seniority | $30k–$80k |
| Southeast Asia | Competitive rates, rising product/design strength | $40k–$90k |
| MENA | Government/enterprise exposure, Arabic localization | $45k–$95k |
| Africa | Growing ecosystems, strong value in emerging hubs | $30k–$75k |
Your web app development cost in 2026 will land where scope, risk, and partner intersect. Use the complexity tiers, partner comparisons, and regional rate ranges here to move from guesses to a credible plan. Keep non-functional work in scope, require demo-driven delivery, and budget realistic runway after launch. Do that, and your estimate stops being a hope and starts being a plan that delivers.
Ready to lock a credible number? Quokka Labs, your Native AI Engineering Services partner, can deliver a one-page Web App Cost Map - scope, hours by feature, rate assumptions, and a 90-day delivery plan.
Share your top three workflows and target launch date, and we will craft a focused plan you can take to stakeholders. Let’s Talk!

How Much Does Food Delivery App Development Cost? Features, Tech & Budget Explained
By Dhruv Joshi
5 min read
How to Make an App Like DoorDash: Product Strategy, Tech Stack, and Real Costs
By Dhruv Joshi
5 min read
React Native Authentication: Secure Login, OAuth with PKCE & Token Storage Best Practices (2026)
By Dhruv Joshi
5 min read
React Native App Security: Risks, Solutions, and Best Practices
By Dhruv Joshi
5 min read

Web App

5 min
Discover how modern web application architecture helps you build faster, more scalable, and cost-efficient web apps in 2026. This guide covers layers, patterns, performance, security, and real-world scenarios, so tech leaders and founders can design smarter systems, avoid costly rework, and align architecture with business goals. Learn when to refactor, when to scale, and how to future proof your product with expert guidance from experts.


Web App

5 min
Modern web applications demand architectures built for scale, resilience, and speed. This guide breaks down cloud-based web application architecture, from microservices and serverless models to security, scalability, and cost control, helping teams design systems that grow reliably with user demand.


Web App

5 min
Modern web applications demand more than quick builds; they require architectures built to scale. This guide breaks down the most popular web frameworks, comparing their strengths, tradeoffs, and scalability models to help teams choose the right foundation for performance, growth, and long-term reliability.


Feeling lost!! Book a slot and get answers to all your industry-relevant doubts